

bjorn.hannrup@skogforsk.se
+46 (70) 518 85 39

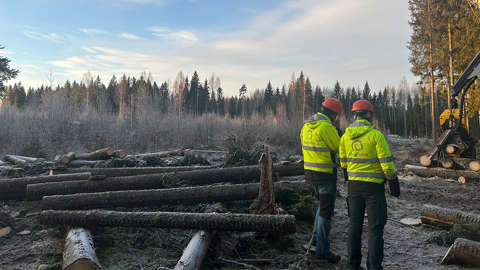
A well-functioning bucking system is essential for maximizing timber value recovery. Skogforsk has previously conducted tests of machine systems from leading manufacturers on four occasions (1995, 2001, 2006, and 2016). The fifth test was carried out in the autumn of 2025 in a final harvest stand in northern Uppland in Sweden, with Stora Enso serving as host. Seven machine systems participated in the evaluation.
The tests have followed a similar experimental design, assessing machine systems with regard to dimensional measurement, bucking performance, volume calculation, and overall functionality. The three most recent tests also included timber handling. In 2025, an additional evaluation was conducted to assess the accuracy of harvester positioning of individual trees and logs.
The results for length measurement showed that, on average, 91.6 % of measurements were within ±2 cm for sawlog assortments, with a standard deviation of 1.4 cm. Compared with the 2016 test, the improvement is statistically significant, confirming the positive development observed since 1995.
For diameter measurement, 79.1 % of measurements were within ±4 mm, with a standard deviation of 3.78 mm. Compared with previous tests, no improvement was observed in the proportion of measurements within ±4 mm; however, a statistically significant reduction in variability was recorded.
This suggests that current limitations are primarily related to calibration procedures rather than the measurement capabilities of the harvesters themselves.
The manual control measurements of length and diameter were also used to evaluate the harvesters' volume calculations. For six of the seven machine systems, deviations in total under-bark volume were less than ±2 % compared with the control measurements. One system showed a larger deviation, which was linked to the use of an incorrect bark function.
Bucking performance, which measures how effectively bucking captures the theoretically maximum timber value, averaged 99.1 %, representing an increase of 0.3 percentage points compared with 2016. These high levels demonstrate that value bucking functions effectively across all systems, with accurate stem predictions and efficient value optimization.
When bucking performance was instead calculated using control-measured data, results ranged from 96.1 % to 98.4 % (average 97.8 %), representing an increase of 0.5 percentage points compared with 2016. The lower performance level based on control measurements is mainly explained by measurement errors in the harvesters’ length and diameter measurements.
The evaluation of distribution performance showed that distribution bucking generally functioned well. For all but one machine system, results were in line with reference values obtained from bucking simulations of the same stems.
Six of the seven systems supported minimum-diameter search according to StanForD 2010, but the results indicate room for improvement in top handling. A proposed target level for regeneration felling of spruce is that both the mean and median diameter at the final cut should be below 60 mm.
For all machine systems, chain speed during cutting remained below the maximum permitted level of 40 m/s. A new feature of this year's test was that three systems were equipped with RPM sensors in the saw motor, enabling better initial calibration of chain speed.
Cutting times varied between systems, with the fastest having approximately 16% shorter cutting times than the slowest. The differences were greatest for small diameters and decreased as stem size increased. Compared with the 2016 Timber Value Test, no clear change in average cutting time was observed.
The assessment of timber handling showed that the proportion of logs with deep spike damage remained unchanged compared with 2016. Three machine systems produced no logs with penetration depths exceeding 7 mm. For the remaining four systems, the proportion of logs with penetration depths greater than 7 mm exceeded the timber measurement regulations' threshold value of 5 %.
On average, 48 % of logs had bucking splits at the butt end and 23 % at the top end when cut without support. The splits averaged 67 mm and 53 mm in length, respectively. These levels were largely identical to those recorded in 2016, although the splits were somewhat shorter.
Bark damage averaged 4.1 % of the circumference down to the wood surface and 6.2 % down to the inner bark. The associated energy-value loss was estimated at approximately SEK 3 per cubic metre under bark (m3sub). These levels were similar to those measured in 2016.
All control systems handled instruction files in accordance with StanForD 2010 effectively. Six of the seven systems also allowed updates during ongoing production. However, the workflow for updating tree species instructions (SPI) could still be simplified further.
Stem positioning was implemented by Ponsse, John Deere, and Komatsu. The results show that individual trees can be distinguished with high precision.
Only Komatsu had implemented log positioning. The log centre point was determined with an average error of 0.42 m and a standard deviation of 0.52 m. Direction was determined with an average error of 7.4 degrees. These results are considered very good, especially given the greater technical challenges associated with log positioning compared with stem positioning.
Overall, the results demonstrate that both stems and logs can be positioned with high precision. This creates opportunities for new applications in the near future. It is therefore important that more manufacturers implement this technology.
The 2025 Timber Value Test shows that modern harvester systems have:
The development since 1995 remains positive. At the same time, the results indicate that the pace of improvement is slowing. To drive further progress, greater focus is needed on factors that directly affect value recovery. One possible direction is the development of methods for better handling of stem curvature and internal decay in the wood.